White Paper: Butterfly Model vs Runner-Chaser Valet Pickup & Drop-off
HopDrop technology is designed to help car dealerships streamline their valet pick-up and delivery process. One of the key features of the software is its use of the Butterfly Model, a mathematical algorithm that optimizes the scheduling and routing of valet drivers. By using this model, the software is able to minimize the total travel time for valet drivers and maximize efficiency. It reduces the number of shuttle drivers required to transport valet driver which leads to cost savings for the dealership. Traditional valet pick-up and delivery software often use a runner and chaser model, which results in the need for more shuttle drivers to transport valet drivers and ultimately leads to higher overall costs for the dealership.
Table of Content
- What's the Runner-Chaser Model?
- Butterfly Model: One Chaser Multiple Runners
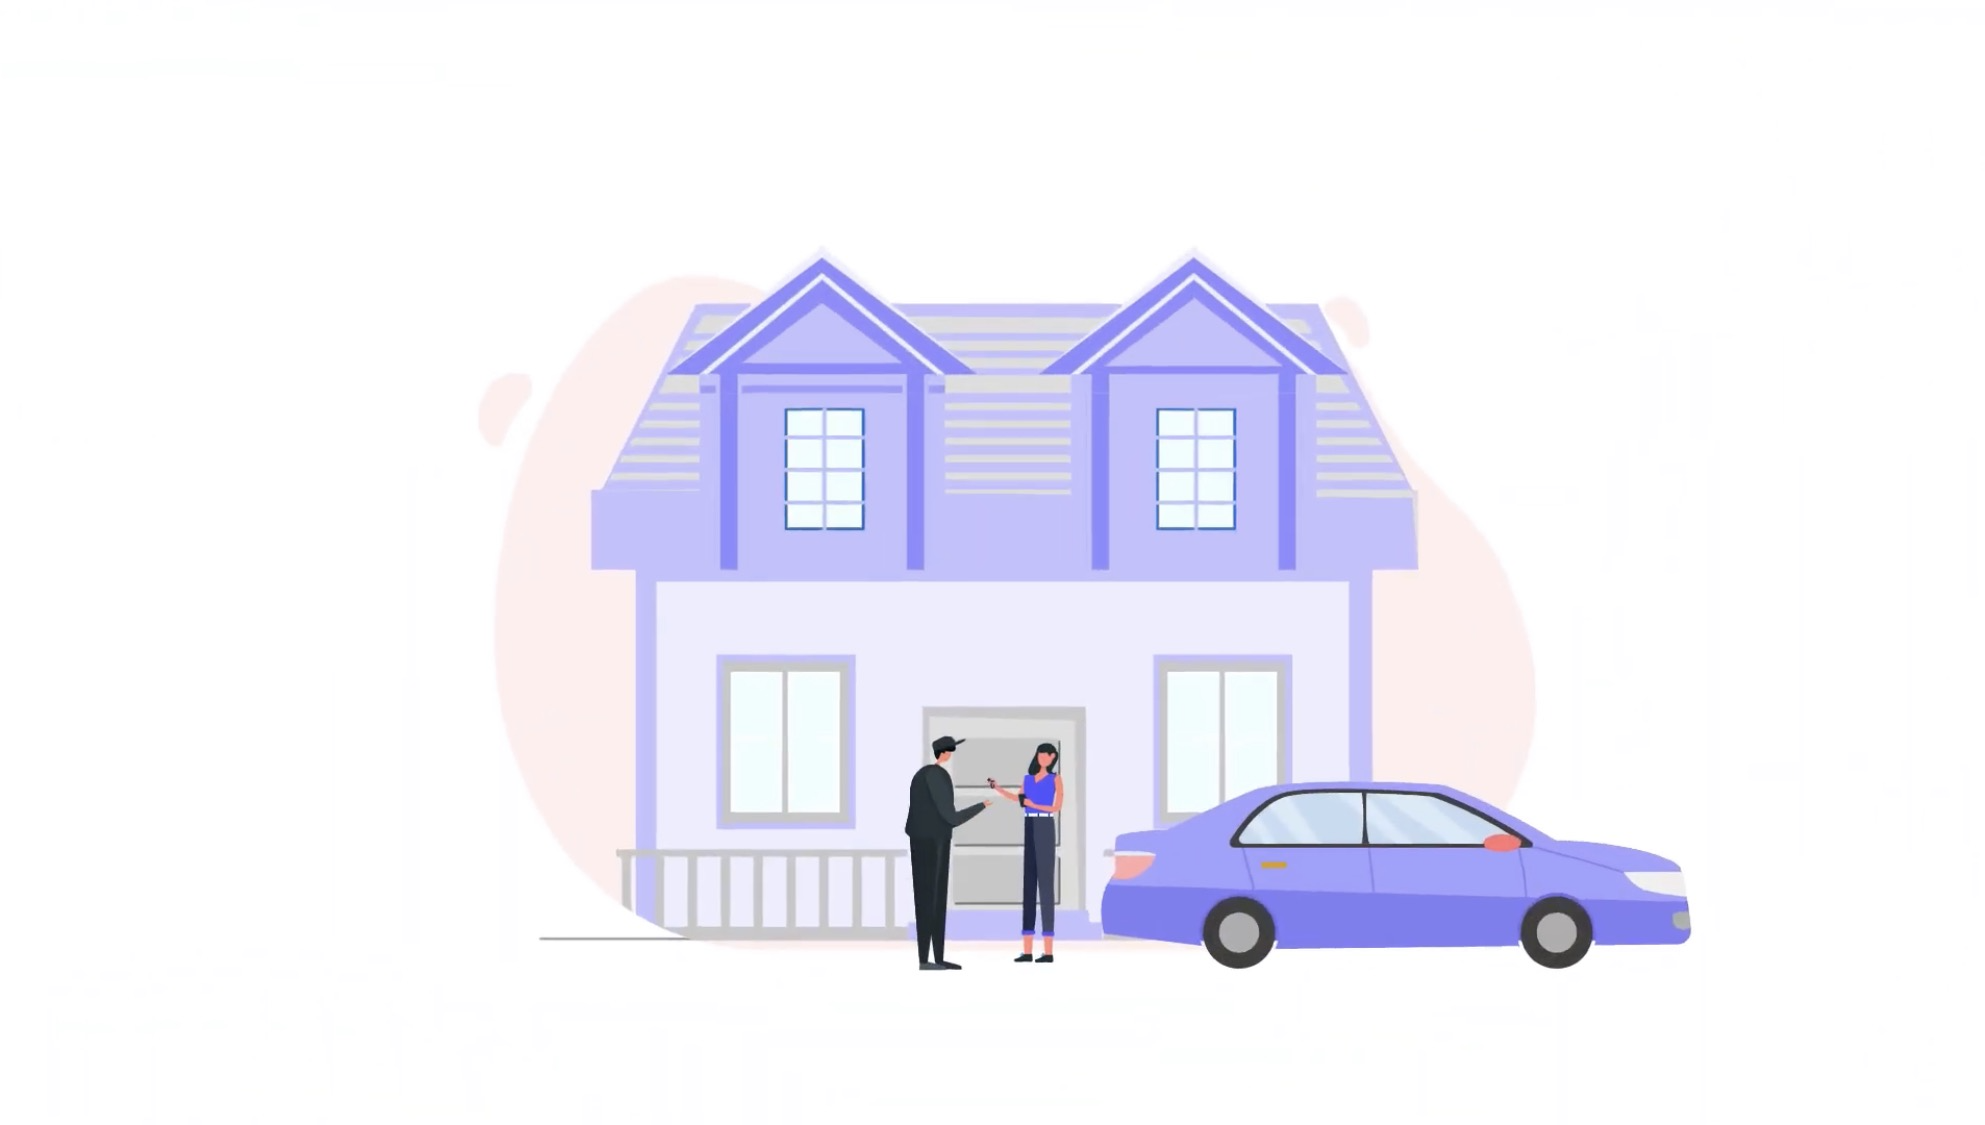
- Context: Valet Pick-up and Delivery
- Dealership Valet Software
- Dealership Valet Scenario
- How Butterfly Model was Developed
- Conclusion
What's the Runner-Chaser Model?
The runner-chaser model is a mathematical way of describing the movements of two agents that are interacting with each other. These agents could be prey and predator, or something being chased and something doing the chasing. The model includes equations that show how the agents move and how they interact with each other. The agent being chased is called the "runner", and the agent doing the chasing is called the "chaser". How the system behaves depends on the values of the parameters in the model, such as the relative speeds and turning rates of the two agents. This model can be used to study a lot of different things, like how predators and prey interact, how groups of animals move together, and how games of chasing and escaping work.
Butterfly Model: One Chaser Multiple Runners
A situation where one person is chasing multiple others can be modeled using an extension of the traditional runner-chaser model, called the Butterfly Model. It's all about the chaser trying to catch one of the multiple runners, while the runners are trying to escape. The model can be used to study how different factors, such as the relative speeds and turning rates of the agents, impact the overall dynamics of the situation and the chances of capture.
For example, imagine a police officer chasing multiple suspects who are trying to get away. The officer can move faster, but they can only see in one direction, while the suspects can move in any direction, but they're slower. In this situation, the officer's actions can be described using the chaser's equations, and the suspects' actions can be described using the runners' equations. The interaction between the officer and suspects can be modeled using a set of equations that show how the distance between them changes over time.
Another scenario where this model can be applied is in robotics, where multiple robots are working together to complete a task and a supervisor robot is keeping an eye on the other robots. The supervisor robot is the chaser and the other robots are the runners. The model can be used to predict the robots' behavior and help the supervisor robot make the best decisions to complete the task. The scenario can also be applied to a dealership valet pick-up and delivery service where a shuttle driver picks up and drops off valet drivers as they go about collecting or delivering customer vehicles.
Context: Valet Pick-up and Delivery
The Butterfly Model can be applied to a shuttle driver (chaser) transporting valet drivers (runners) in the context of a valet pick-up and delivery service offered by car dealerships. In this scenario, the shuttle driver's goal is to efficiently pick up and deliver the valet drivers to their destination (customers) in a timely manner.
The valet drivers are the "runners" in the model, and their starting point, live location, and final destination (customer's location) are always known. The shuttle driver, or "chaser", needs to navigate to the valet drivers' location, pick them up, and deliver them to their destination (customer's location) before a certain time limit. The valet drivers may have different schedules and destinations, and the shuttle driver must make decisions on the best route and pick-up order to minimize the total travel time and maximize efficiency.
The model of this scenario can be represented by a set of differential equations that describe the motion of the shuttle driver and the valet drivers. The parameters of the model can be adjusted to reflect the relative speeds and turning rates of the agents, as well as the time limit for the delivery. The model can be used to study the effects of different strategies on the total travel time, and to optimize the shuttle driver's route and pick-up order.
Simulation and optimization techniques can also be used to test different scenarios and find the optimal strategy for the shuttle driver. For example, the shuttle driver can use a gradient-based optimization algorithm to find the best route and pick-up order based on the live location of the valet drivers and their destination. Additionally, data visualization can be used to show the motion of the agents over time, and the effect of different strategies.
The Butterfly Model can be used to optimize the shuttle driver's route and pick-up order in a valet pick-up and delivery service. Simulation, optimization and data visualization techniques can be used to test and understand the dynamics of the system, and to find the best strategy for the shuttle driver.
Dealership Valet Software
The Butterfly Model can be applied to a valet pick-up and delivery software for car dealerships. In this scenario, the software's goal is to efficiently schedule and coordinate the pick-up and delivery of cars by valet drivers (runners) to customers (final destination) in a timely manner. The valet drivers are the "runners" in the model, and their starting point (dealership location), live location, and final destination (customer's location) are always known. The software, as the "chaser" needs to coordinate the valet drivers' schedules and routes, to minimize the total travel time and maximize efficiency.
The software can use the live location of the valet drivers, as well as the customer's scheduled pick-up and delivery times, to estimate the time of arrival and plan the routes accordingly. It can also consider factors such as traffic, weather conditions, and the distance between pick-up and delivery locations to optimize the routes.
Optimization algorithms can also be used to find the optimal scheduling and routing strategy for the valet drivers. The software can use optimization algorithms to find the best pick-up and delivery schedule for the valet drivers, based on the current location, availability and the destinations of the valet drivers. For example, the algorithm can be set up to minimize the total travel time for the valet drivers, while taking into account the customer's scheduled pick-up and delivery times, traffic conditions and the distance between pick-up and delivery locations.
The software can also use data visualization techniques to show the motion of the valet drivers over time, and the effect of different scheduling and routing strategies on the total travel time. Interactive visualization tools such as dashboards can also be integrated into the software, allowing the dealership managers to explore the results of the simulation and change the parameters of the model interactively.
Additionally, the software can also include features such as real-time tracking of the valet drivers, automatic notifications to customers on the status of their pick-up or delivery, and integration with other systems such as payment systems and inventory management systems.
In conclusion, the Butterfly Model can be used to develop a powerful and efficient valet pick-up and delivery software for car dealerships which can help improve the overall customer experience, increase efficiency and reduce costs. The software can use mathematical modeling, simulation, optimization and data visualization techniques to schedule and coordinate the pick-up and delivery of cars, and also include features such as real-time tracking and integration with other systems.
Dealership Valet Scenario
- 1 chaser (shuttle driver), 4 runners (valet porters)
- Runner's live location and the starting point and the final destination are always known
- Chaser needs to and can only capture the runners when runners arrive at the final destination (customer's home or dealership).
- Runners stay at the final destination for a known period of time, then they'll leave the final destination and can never be captured.
In this scenario, there is one person (the chaser) trying to capture four other people (the runners) before they leave a specific destination. The chaser knows where the runners are starting from, where they are currently, and where they are going, and also the runners stay at the final destination for a certain period of time before leaving.
The chaser must find a balance between moving quickly and accurately. If they move too fast, they might arrive at the destination before the runners, but if they move too slow, the runners might leave before the chaser gets there. The chaser can use the runners' current location to predict when they'll arrive at the destination and plan their pursuit accordingly.
The runners can try to avoid capture by taking different routes to the destination or by trying to arrive at different times than the chaser expects. They can also try to mislead the chaser by providing false information.
The model of this scenario can be represented by a set of equations that describe the motion of the chaser and the runners. The parameters of the model can be adjusted to reflect the relative speeds and turning rates of the agents, as well as the time that the runners stay at the final destination before leaving. The model can be used to study the effects of different strategies on the likelihood of capture, and to optimize the chaser's pursuit strategy.
How Butterfly Model was Developed
-
Mathematical equation: Formulated the mathematical equations that describe the motion of the chaser and the runners in the Butterfly Model and analyzed the stability and behavior of the system as a whole.
-
Simulate the model: Simulated the model using different sets of parameters, such as the relative speeds and turning rates of the agents, and the time that the runners stay at the final destination before leaving to help us understand how different strategies affect the likelihood of capture.
-
Optimize pursuit strategy: Developed an optimization algorithm to find the best pursuit strategy for the chaser, based on the current location and destination of the runners.
-
Data visualization: Visualized the results of the simulation, such as the movement of the agents over time, the likelihood of capture, and the effect of different strategies on the system's behavior.
Mathematical Equation
In the Butterfly Model, the chaser's goal is to capture the runners at their final destination, before they leave. The runners' starting point, live location, and final destination are always known, but the runners stay at the final destination for a known period of time before leaving and becoming uncapturable.
To mathematically describe the motion of the chaser and the runners, we can use a set of differential equations.
For the chaser, we can use the following equations:
- x_c' = v_c * cos(theta_c)
- y_c' = v_c * sin(theta_c)
- theta_c' = w_c
- x_r' = v_r * cos(theta_r)
- y_r' = v_r * sin(theta_r)
- theta_r' = w_r
Simulate the Model
A simulation is a powerful tool that can be used to understand how systems work. In the case of the Butterfly Model, it helps us to see how the chaser and the runners interact under different conditions, and how different strategies can affect the likelihood of capture.
To simulate the Butterfly Model, we first need to solve the set of differential equations that describe the motion of the chaser and the runners using numerical methods. Once we have a numerical solution, we can then vary the parameters of the model, such as the relative speeds and turning rates of the agents, and the time that the runners stay at the final destination before leaving.
We can also use visualization techniques to show the motion of the agents over time and to see the effects of different strategies on the likelihood of capture. For example, we can simulate the model with different values of the runners' speeds and the chaser's speed and see how it affects the likelihood of capture. We can also simulate the model with different values of the runners' visibility and see how it affects the chaser's ability to locate the runners.
It's important to keep in mind that simulating a model is not the same as a real-world scenario. Many factors can't be included in a simulation, so it's important to validate the simulation results with real-world experiments. Overall, simulation is a great way to test and study a system in a controlled and repeatable manner, but real-world experiments are necessary to validate the results.
Optimize Pursuit Strategy
In the Butterfly Model, the chaser's goal is to capture the runners at their final destination before they leave, while the runners attempt to evade capture. To achieve this goal, the chaser must choose an appropriate pursuit strategy that balances the need for speed with the need for accuracy.
One way to optimize the chaser's pursuit strategy is to use optimization algorithms. These algorithms can be used to find the best pursuit strategy for the chaser, based on the current location and destination of the runners. There are different types of optimization algorithms, such as gradient-based, evolutionary, or swarm-based algorithms, that can be used to solve this problem. These algorithms can be used to find the optimal values of the parameters that describe the chaser's motion, such as the velocity and turning rate.
Another approach is to use reinforcement learning (RL) algorithms. RL algorithms can help the chaser's agent to learn the best pursuit strategy by interacting with the environment. The agent receives rewards or penalties based on its actions and the outcome of the pursuit, and it learns to optimize its behavior over time to maximize the rewards.
Keep in mind that optimizing the chaser's pursuit strategy can be a complex task, and it may require a combination of mathematical modeling, simulation, and optimization techniques. The choice of the optimization algorithm and the approach will depend on the specifics of the problem, the available data, and the computational resources. But ultimately, the goal is to find the best pursuit strategy that maximizes the likelihood of capture while taking into account the constraints of the problem.
Data Visualization
Data visualization is a crucial aspect in understanding the dynamics of the Butterfly Model. It allows us to see the motion of the agents over time and to see the effects of different strategies on the likelihood of capture. There are various types of visualization techniques that can be used to represent the results of the simulation, such as 2D or 3D plots, animations, and interactive visualization tools.
For instance, a 2D plot can be used to show the motion of the chaser and the runners over time, where the x and y axis represents the position of the agents in a 2D plane, and the color or shape of the markers can represent the time. This type of visualization can help to understand the overall pattern of the motion and the interactions between the agents.
Another example is to use a 3D plot to visualize the likelihood of capture as a function of the chaser's speed and the time that the runners stay at the final destination before leaving. We can use different colors to represent the likelihood of capture and see how it varies as we change the parameters of the model.
Animations can also be used to show the motion of the agents over time, which can help to understand how the agents move and interact with each other.
Interactive visualization tools, such as dashboards, can be an effective way to explore the results of the simulation and to change the parameters of the model interactively. This approach makes it easier to understand the results and enables the user to gain new insights by exploring the data in different ways.
Conclusion
HopDrop is a valet pick-up and delivery software that uses the Butterfly Model to optimize the schedules and routes of valet drivers and improve the efficiency of dealership's valet operation. It uses mathematical modeling, simulation, optimization, and data visualization techniques to coordinate the pick-up and delivery of cars, and also includes features such as real-time tracking and integration with other systems to help dealerships draw a better return on investment (ROI) from their valet operation.